Mathematical Transformation
The project Mathematical Transformation involves us investigating a topic in the world and trying to find the linear and non-linear relationships within the topic we are researching. Then once we pick a topic about anything in the world we will pick a linear and non linear relationship and then graph the relationships, as well as making tables to show our data. Once we have done this, we will then somehow display our data weather it's a painting or video or any other way you would like to show off your work. After we are all done with these steps then we will present them on the night of exhibition where we will explain this project.
Also we learned about other classmates topics and how their relationships were linear and non linear. The purpose of this project is for us to apply math to real world situations. And to also learn about non linear and linear relationship and understand the difference between best line of fits and changing slopes. I chose to investigate on my soccer team's results within 11 games. My linear relationship was how many times we practice within each week. My non linear relationship was how many times we scored in a game, and the amount of times we scored in 1 game was non linear to the amount of times we scored in the 2nd and 3rd game. The reason why i chose to investigate on soccer was because I wanted to see how good our soccer team was and what we needed to improve on whenever we loss a game. I also chose this because I thought it would be a fun way of displaying soccer and the creative piece I made for exhibition. I got my information for my graphs and tables on a website called csl.com. which stands for coast soccer league. Then once you get their, there is a divison between boys and girls and you put girls and then it asks for you age divison and you put u14, then you pick which division your in and we are in a division called Premiere which is the highest premiere team you can become. Then it will take you to about 10 teams who are in all of those divisions then you will see a team call Carlsbad Elite and we are currently in 1st place.
Also we learned about other classmates topics and how their relationships were linear and non linear. The purpose of this project is for us to apply math to real world situations. And to also learn about non linear and linear relationship and understand the difference between best line of fits and changing slopes. I chose to investigate on my soccer team's results within 11 games. My linear relationship was how many times we practice within each week. My non linear relationship was how many times we scored in a game, and the amount of times we scored in 1 game was non linear to the amount of times we scored in the 2nd and 3rd game. The reason why i chose to investigate on soccer was because I wanted to see how good our soccer team was and what we needed to improve on whenever we loss a game. I also chose this because I thought it would be a fun way of displaying soccer and the creative piece I made for exhibition. I got my information for my graphs and tables on a website called csl.com. which stands for coast soccer league. Then once you get their, there is a divison between boys and girls and you put girls and then it asks for you age divison and you put u14, then you pick which division your in and we are in a division called Premiere which is the highest premiere team you can become. Then it will take you to about 10 teams who are in all of those divisions then you will see a team call Carlsbad Elite and we are currently in 1st place.
Linear
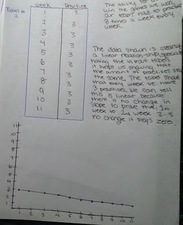
What you see here is my linear relationship and as you red before the relationship is how many times we practice each week. The graph has no change in slope and it has a straight line going across the entire graph. It goes all the way across because it always stays 3 because that is how many times we practice in a week. (you might see how the line is a little bit slanted but don't worry it's not cause there is a change in slope or anything, it's only cause I didn't draw a straight line). This is a linear graph and table because there is no change in slope. Meaning that the numbers of practices don't change, therefor neither does the points on the graph or the numbers on the table.
What you see here is my linear relationship and as you red before the relationship is how many times we practice each week. The graph has no change in slope and it has a straight line going across the entire graph. It goes all the way across because it always stays 3 because that is how many times we practice in a week. (you might see how the line is a little bit slanted but don't worry it's not cause there is a change in slope or anything, it's only cause I didn't draw a straight line). This is a linear graph and table because there is no change in slope. Meaning that the numbers of practices don't change, therefor neither does the points on the graph or the numbers on the table.
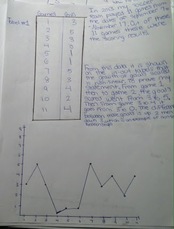
This is the non linear graph and table. As you can tell the graph looks much different then the linear graph and thats because on this graph there is a line connecting all the points together and because the points aren't lined up all in one big straight line. This table and graph are non-linear because there is always a change in slope and the amount of times we scored does not stay at 1 number, it is constantly changing from 1 goal to 2 goals to 5 goals. You can tell right away when you look at this graph that it's non linear because the points/line goes up,up, then way down to the bottom.
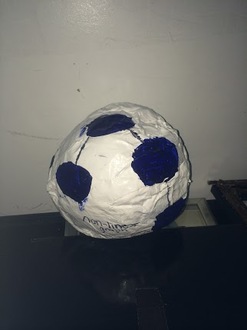
This was my final product. There is one side of the soccer ball that you see and this side of the soccer ball is non linear and the other side of it was linear. As you can see I took part of the graph from my data and I painted it on one side so that you can see the non linear relationship and it still looks like a soccer ball and then on the other side it was the linear relationship. I decided to make my piece a soccer ball with the graphs of the linear and non linear relationship on each side of the ball because I thought it would be cool to make my model 3D. I also thought that it was a very creative idea because it still looks like a soccer ball and it shows the graph of the relationships. My inspirations for this piece was really simple, I just thought of making a soccer ball and then using a sharpie to make the non linear graph. I didn't really have any specific inspiration, I did get some helpful ideas of how to make it look amazing by my peers.
The steps i took to create this was, First I mad paper mache and blew up a balloon for the pape rmache to get the shape of a soccer ball. Then I got newspaper and cut strips of it to dip into the paper mache. Then after I made strips I then dipped it into the paper mache and laid it on the ballon I did this enough to cover the balloon then to speed up the process of drying I put a tray into the dryer, laid down a towel and placed the balloon in the dryer. This only took about 10 minutes to dry vs letting it air dry and taking about 7 hours. After it was dry I repeated the process over and over about 4-5 times.
The steps i took to create this was, First I mad paper mache and blew up a balloon for the pape rmache to get the shape of a soccer ball. Then I got newspaper and cut strips of it to dip into the paper mache. Then after I made strips I then dipped it into the paper mache and laid it on the ballon I did this enough to cover the balloon then to speed up the process of drying I put a tray into the dryer, laid down a towel and placed the balloon in the dryer. This only took about 10 minutes to dry vs letting it air dry and taking about 7 hours. After it was dry I repeated the process over and over about 4-5 times.
Overall this project was really fun and interesting. I think one of the funnest and most meaning full part of this project was trying to find a way of how to make an art piece and still show the math we learned in class about linear and non linear relationships. I think that everybody's final product is what went well because I was able to learn about a lot of other examples of non linear relationships. I don't think that anything really didn't go well because to me it was all really smooth and everything just fell in place. Next time I would've done different would be starting the project about a week earlier because I made the soccer ball out of paper mache and that stuff takes a long time to dry before doing another coat. A habit of Mathematician that went well for me was Being confident,patient and persistent. I feel this is what I was good at because I was very patient and whenever the ball wasn't fully dry and even though I was in a hurry to complete the project I put it back into the drier. I was also very organized, specially with the process of drying and the steps for the paper mache I felt like I was ready to finish and get it done good. I think I could've been better at the Mathematic of seeking why and Prove because When sometimes it wasn't dry I didn't know how to understand when it was full dry and I think thats why It turned out how it did cause it wasn't full dry. This was a wonderful project and I was very proud of the work I completed.
