Power, Privilege & The Pur$e
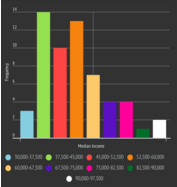
The Power,Privilege and the Purse project is a project for learning about the societies wealth, different privileges between races, and the power within communities. The mathematics side of this project mainly focused on personal budgeting as well as statistics of chosen topics from students. Throughout this project we used a website called info-gram where we were able to create graphs based on information we researched for our project, for an example my infographic was on median income throughout the country. This project was very educational for myself because I wasn’t aware of statistics on topics that I don’t hear about. So learning about basic things about our world was interesting.
Pictures
Deeper learning:
I learned that money is very tight, it’s hard to budget for your life on a( an estimated) income and care for yourself. It was a reality shock in a way of not recognizing the expenses of life. But something I really took away was watching the video of a cartoon girl who made a wrong choice with her money for college and ended up in debt she couldn’t afford to pay off, so basically decision making and always finding the best scenario in which you won’t be worried for the next 10 years of paying off your education. Using formulas that result in accurate responses on the google docs spreadsheet is the type of math that I feel really benefited me throughout working with budgeting and savings. Specifically, plugging in your total estimated amount of money you have and dividing that into categories in which you would have to either save, pay, spend for the month.
Compounding interest was a topic I found interesting because it’s so real world alike, that it’ll be something that we will have to face and understand later in life. I learned that the exponential growth of it depends on the loan amount and the period of time that you take to pay it back, but it’s tricky because loans can get you in a cycle of more and more loans which puts you in great debt.
Logarithms was also another subject that I am happy I learned about, but I wish we had revisited it so that I didn’t forget how to calculate it, which is what has ended up happening. Once I learned how to use logarithms it was quite easy, also learning log with examples of real life problems was something I found beneficial.
There were a couple times in this project were we needed to create graphs of information so using the Statistical Process came naturally starting with planning our information topic, then to collecting the data, next analyzing the data, then finally discussing the piece of visual graph we created.
Certain types of mathematically measurements I used was the basic topics that were taught in class for an example Logarithms, Exponents, Standard Deviation etc. I think what I really took out of it was a hint into a future of what type of bills I will be paying from our budgeting once we are 25, or learning about all the mathematical topics over this entire project that related back to Power and Privileges in the world.
We were able to bring statistics into this project which in math we were able to graph them and have an understanding of how that data came to be. Taking that from social issues in this world was really neat to tie our work together.
“Mind the Gap” Exhibition
Exhibition night was a great way of showcasing our work, one way or another everyone was able to describe their work to the community. My role in this project was publishing a newspaper with articles and work inside it from other members who was a publications. The format of writing had a unique variety in order to reveal the realisticness of the newspaper. In the beginning of this project I didn’t take on the leadership role, and gradually as our entire publications team separated into 2 groups, I started to take on the role of pinning ideas and suggesting possible ways to put together our work. So I grew into learning to take a leadership role, but except to take it on earlier.
