Probability
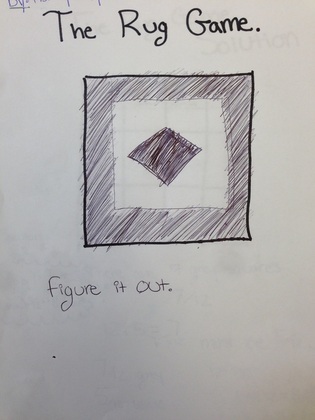
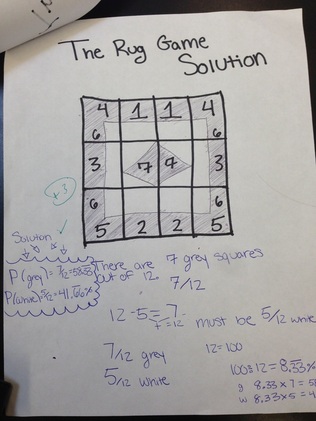
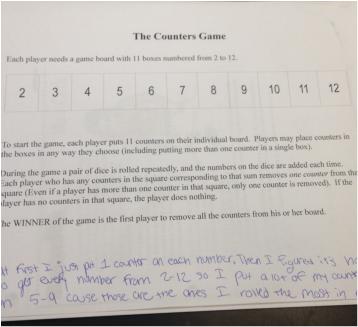
In this unit we studied probability. We did theoretical and physical experiments to show us different types of probability and how you can predict certain things with the right amount of data. I already thought I had a good mind set on probability and how to predict it. But over the course of this unit I learned about different types of probability and that sometimes you can't get the exact answer for searching for probability, sometimes you get down to the basic and from there you just have to kinda choose. For an example the counters game was a sample of probability. For this game there was a bar that had the numbers 2-12 on it and we were given 11 little colored tablets to place over the numbers. But we got to choose were we wanted to place the small tablets. After we placed them on the board we were given a pair of dice, we were to roll it once and if the numbers added up to a number that theres a tablet over then you get to take it off. The objective is to try and get all your tablets off the table before your partner does. But to make it fair you get to roll the die once and then your partner. So the first game I played I put one tablet on each number. Which was easy for a while until I got to the 2,3,4 and when I got to 10,11,12 so basically I was only rolling the numbers 5-9. So after a while I eventually got the rest of the numbers. So then the next game I thought to myself well last time I was only rolling the numbers 5-9 so then I put about 2 tablets on each number from the numbers 5-9. I thought this was a great idea because I knew I would be able get those numbers faster then my partner can get all of his. Of course when I start rolling I'm started to get high doubles like 10,12. I was so shocked because those weren't the numbers that I was getting last time. After that game I thought that there was no way of telling which numbers to get because it's all just luck. Until in class we went into a deeper method of which numbers to pick and the most likely numbers was 6-8 and that's because they had the most combinations of different numbers, for an example lets say you choose 2 well there is only 1 possible combination to get that 2 which is 1&1, but lets say you pick 7. There are 3 different possible combinations to choose from. 3&4 5&2 and 6&1. So overall I really enjoyed this mini worksheet because we were actually able to experiment the data, which I think is incredibly fun because it's hands on instead of just thinking about the probability we actually got to calculate all of it. This worksheet is an example of simulation and experiment. Now for an example of theoretical analysis. First theoretical analysis means that instead of actually experimenting the problem your more likely to create your own and just do it on a sheet of paper, it's more of calculations. Another worksheet we did that was able to show what theoretical analysis was is Mia's Card's. The problem for this game was that this girl named Mia has a full deck of cards. And if she pulls out a heart then she gets 10 points but if she pulls any other card she only gets 5 points. The question is what is the average number of points she gets when she picks a card. So what the fist thing I did was make a ratio of the number of hearts to the number of other cards and that was 13:19 then I took that and simplified it to 1/4. So we have a fraction of 1/4 she will select hearts and 3/4 she will pick any other card besides hearts. Then I made that ration out off 100 so it would look like this 25/100 of getting 10 points and 75/100 she will get 5 point card. After I made those ratio's I multiplied each of the ratios by how many points you would get. So I multiplied 25 by 10and I got 250 points. Then I multiplied 75 by 5 and got 375 points. After I got these two numbers I just divided by 100 to get the points per card instead of points per game. That was 2.5 points and 3.75 and if you add those up you get 6.25 points per card. So I'm sure you can tell the difference between this problem and the counters game. Mia's card game is just more technical and more math where as counters game is fun and experimenting. I am most proud of the rug game that I created, because I think it was a challenging question to solve and it really took me a lot of effort to solve it and create it at the same time. I am proud of my work because it surprised me how good I made it because at first when we were introduced to the Rug Game I had no idea how to do it or even solve it. But I started asking for help and then I was able to create this rug. The images below are evidence of my work. The first two have to do with the rug game, the first image shows the rug game and you have to solve it and then the second image is a picutre of one possible solution to this problem. Then the 3rd image is a picture of the counters game board as I talked about above.
|
|
|
A couple mathematicians I devolved even more throughout this probability project. One of them is staying organized. Staying organized is a big role in this project because we went back to our work a lot and having to keep your stuff together was extremely important. An example of me staying organized was the worksheet expecting the unexpected (the coin flip experiment). For this I made two table from 1-25 and then after flipping a penny each time I would write down weather it was heads or tails. So I stayed organized by creating tables which made it a lot easier. Another habit of a mathematician I feel i developed was experiment through conjectures, I can relate this back to the creating your own rug. Because while making your own you had to test it out yourself and see if you were able to solve it, so there were many times where I had to change the design of the rug because it didn't work out.
